Hi everyone,
I’m starting a thread with a UX analysis of stacking.
Thanks to @codex for compiling data on all this.
We will be posting UX analyses in this thread so stay tuned.
Ryan
Hi everyone,
I’m starting a thread with a UX analysis of stacking.
Thanks to @codex for compiling data on all this.
We will be posting UX analyses in this thread so stay tuned.
Ryan
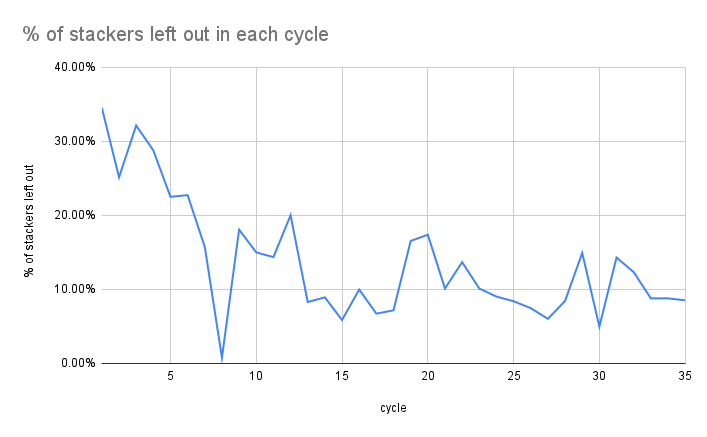
The first chart shows the percentage of stackers kicked out of each cycle. As you can see, it holds steady at around 10%, which is even higher than I imagined it was. Seems to be quite a large problem.

Thank you for gathering this data @ryan and @codex!
Re: the first chart, can you help me interpret the chart better?
stack-stx?, orEDIT: also, are there scripts somewhere that can reproduce this data (or at least can you post a description of how the data was gathered)?
I believe the data is sourced from stacking.club and counts the unique pox addresses, but @codex can correct me here.
We’re focusing on the user experience for non-pool stackers here. So each pool is counted as a single stacker in the data.
There’s other analysis we can do with the data and I’ll see if we can pull this out.
I’d point out that the raw economic loss matters but there’s also a frustration aspect here that can cause people to leave the chain for others, and you don’t see the people who have left in the data.
As mentioned, I believe @codex scraped stacking.club for the data but maybe he has a script to share.
I can post a link to the raw data and you can reproduce it to double check it or you can use the raw data and do your own analysis with it.
Hi @jude,
Indeed I have a script that prepares the data and there are some simple calculations done. I will create a github repo for it so anyone can run and verify.
The majority of this info is collected from stacking.club at the moment. So our first assumption is that this data is correct. If necessary, we can derive it directly from the chain itself.
I’ll come back to answer your questions shortly.
Here is a link to the source of the data.
The columns that I’ve added are the stackersLeftOut* ones and they’re derived from the list of stackers provided in the endpoints.
To answer your question, the Y axis in the chart above is the fraction of stackers that have stacked less than the minimum stacking threshold in that cycle and therefore are not receiving rewards.
I believe the total number of stackers in cycle X is counted based on the number of stackers that have called stack-stx function and their lock period has not arrived. I am creating my own on-chain queries to verify this though.
Thanks for clarifying this point. If this is the case, then the tally would not count delegators acting to stack their delegatees’ STX.
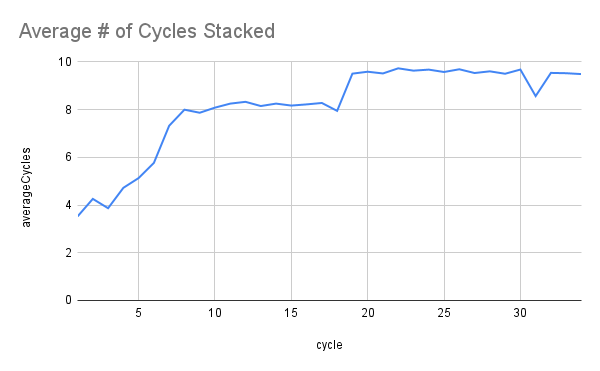
Tangentially, what I’d love to figure out at some point is how many reward cycles a stacker encounters where their STX are locked but they don’t have any reward slots. We could group stackers by the number of cycles for which they stack, and within each group, characterize the distribution of missed cycles. From there, we could work out the expected (and extreme percentiles) number of missed cycles as a function of how many cycles you stack for, and how many STX you stack.
(I’m not saying that you or @ryan have to do the above right now, btw. I think this would useful data regardless of what happens with stacking, because it would not only help inform today’s stackers how much STX to stack and how long to do it for, but also help predict the impact of different stacking behaviors on future designs.)
That’s correct. My understanding is that to count that I should check on delegate-stack-stx function calls. Can you please confirm that?
That seems like a good data point to figure out. I can try to extract that data as well as verifying the numbers above.
No worries. I agree this is valuable information and at the very least sets a better expectation for anyone who is planning to do stacking. I’d be happy to help if I can.

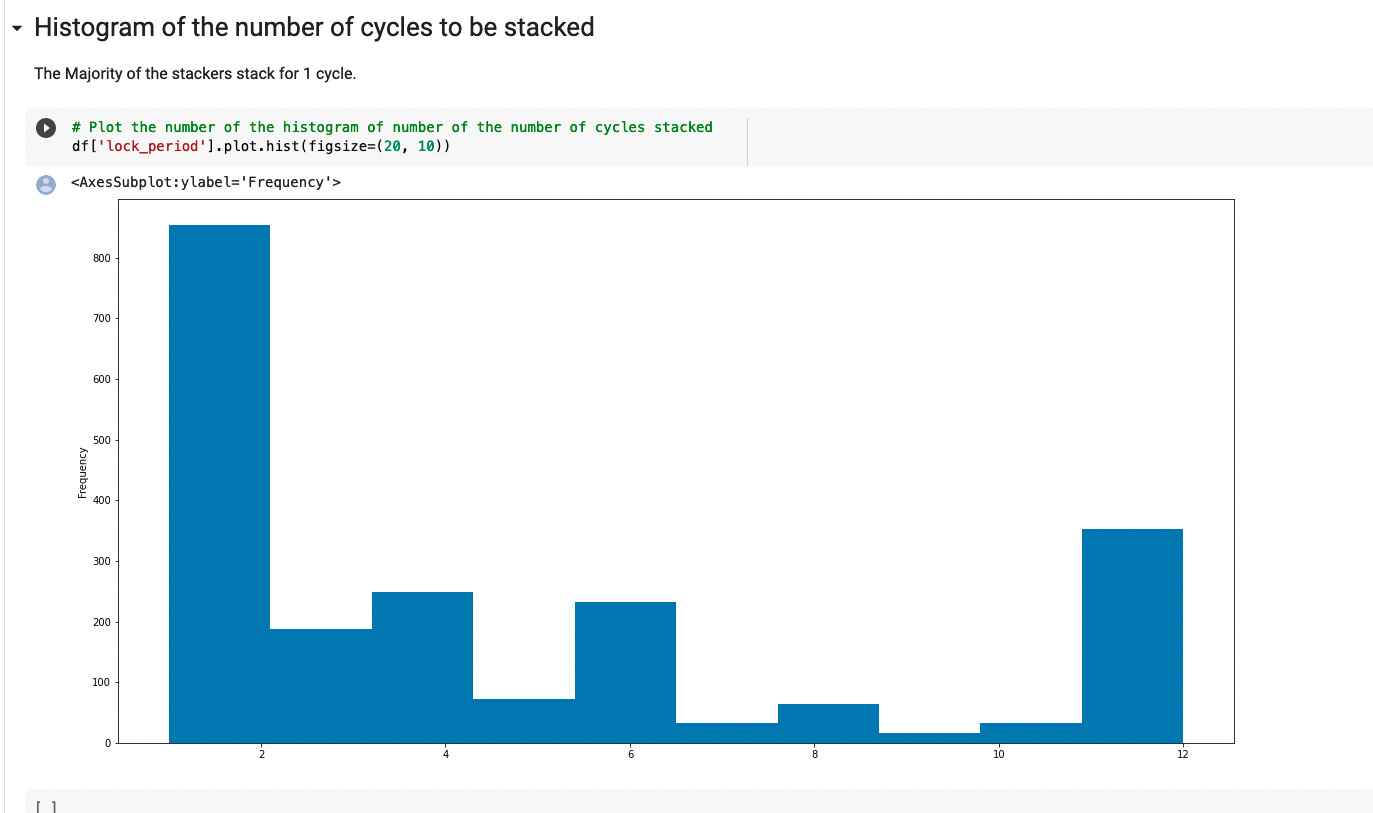
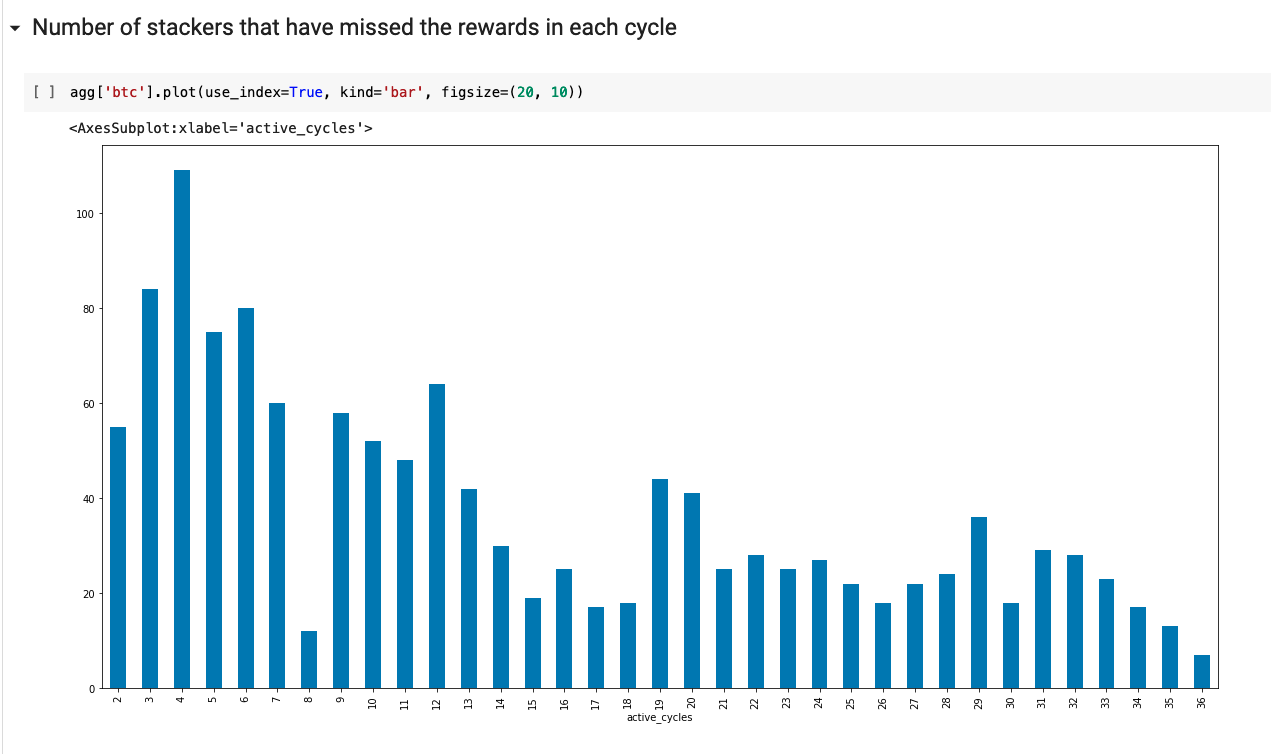
I have compiled some further data on stacking and the cycles that stackers have been missing.
The way I’ve done it is by processing the number of times stack-stx has been called and therefore no pools.
Based on that, I have decoded the pox_address and joined it with burnchain_rewards table to match the rewards with stacks addresses.
Also, I’ve ignored some of the transactions that have a 0x14 version as part of the pox_addr because I was not able to decode it into valid bitcoin addresses in python.
The source code and charts are available at Google Colab.
This is compiled based on my understanding of how stacking works and you’re welcome to verify the findings. I believe still some further work is needed particularly on the analysis @jude mentioned above.

ps. At the moment the jupyter notebook above misses the requirements.tx as I’m now using it for viewing purpose. So running the code will probably fail there. I will update it to work once I get the chance.
I can only post one media at a time so adding more. This seems the most interesting.

There is another one but I cannot post more. You can see it at the bottom of Google Colab